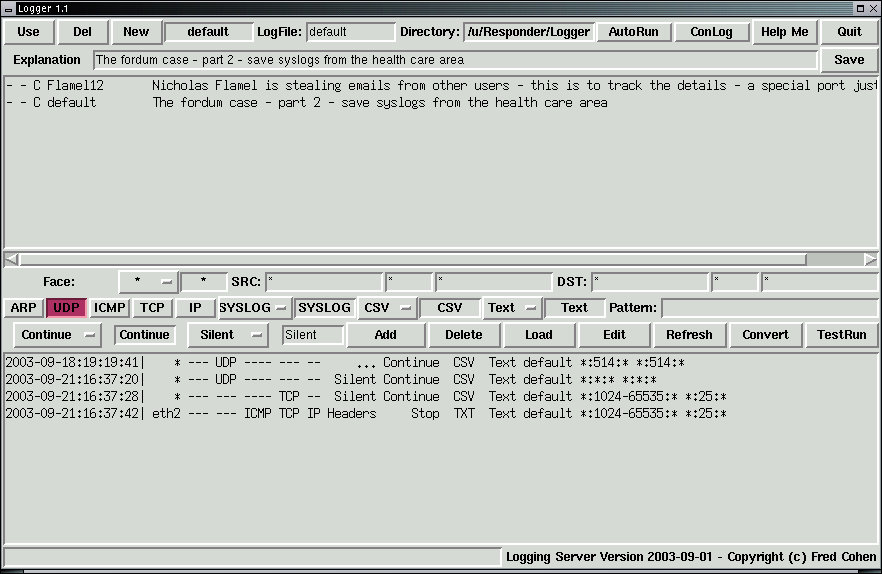
The Logger program is run by selecting [Custom] from the X11 menus. Right-click in an unused part of the X11 window, then Left-click on "Custom". This will produce a graphical interface similar to the one shown in figure 1:
From the GUI, you can configure all of the most common Logger applications not involving in-depth programming.
The top half of the interface consists of two rows of widgets and a window with informaiton on logger specification files. This part of the interface is directed toward managing specification files. Each specification file has sequences of entries identifying sets of packets to log and formats for those logs. The details of each specification are provided in the lower half of the interface. The top half buttons and their functions are as follows:

These buttons and parameters apply to the entire specification file:
| [Use] | Use the (mouse selected) specification file |
| [Del] | Delete the (mouse selected) specification file |
| [Add] | Add a new specification file |
| [AutoRun] | Run this logging activity at system bootup |
| [ConLog] | Save the console log of this one as well as the normal logfiles |
| [Help Me] | Show this helpfile |
| [Quit] | Exits the Logger control menu |
| [Save] | Save the purpose (also saved in other operations) |

The [Explanation] field provides an explanation of the purpose of this specification.
The display area lists the specification files present and their settings

| An 'R' in the first field indicates AutoRun at system bootup |
| An 'L' in the second field indicates console output will be logged |
| A 'C' in the third field indicates Convert has been done for use |
| The name of the specification file is provided |
| The explanation / purpose of the specification is displyed |
To select a specification file and load it for use, Left-click on the line associated with the specification of interest to mark it, and click on [Use] to use that specification. The lower window should also load the logging information associated with that specification.
The bottom half of the display allows individual logging rules within the specificaiton file to be created, deleted, and edited.

The first set of parameters specifies interface and addresses to be logged:
| [Face] | Specifies which (or all) interface to be logged |
Source selection: *, lo0, eth0, eth1, eth2, eth3, eth4, ... allows the user to select which interface (or '*' for all interfaces) this rule should apply to.

SRC		The source address information for packets to be logged
	IP	Source IP address specifier
	PORT	Source Port set specifier
	MAC	Source MAC address specifier

DST		The desination address information for packets to be logged
	IP	Destination IP address specifier
	PORT	Destination Port set specifier
	MAC	Destination MAC address specifier

These parameters control the types of packets listened to for any given entry
| [ARP] | Listen to ARP packets |
| [UDP] | Listen to UDP packets |
| [ICMP] | Listen to ICMP packets |
| [TCP] | Listen to TCP packets |
| [IP] | Listen to other IP packets |
If all of these are 'depressed' all packet types will be considered.

| [SYSLOG...] | Set the parameters for tracking syslog (or ...) packets |
Preset log types: Some of the most common logging activities are provided in this menu. Menu selections generate automatic settings of other field, including protocols, source and destination IP, Port, and MAC addresses, and so forth. This is very handy for setting up other similar configurations as it does most of the work and you only have to change one or two numbers. Entries include SYSLOG, POP3-S, POP3-D, SMTP-S, SMTP-D, ALL, ARP, UDP, ICMP, TCP, and ALLIP. For example, if you want to record telnet sessions, you might select POP3-S (pop3 source) and change the 110 to 23, add the rule, then do the same thing for POP3-D (pop3 destination) and add that rule. These parameters specify the format of the logs for this entry
| [CSV/TXT/DUMP] | Choose the logfile type |
| [Test/Hex] | Choose the format of contents shown in the log (except Dump) |
File format: Three file formats are currently available: CSV, TXT, and Dump. For Dump format, other formatting entries are ignored and the output file is in libpcap format, the same format used by TCPdump and Ethereal. Output in this format can be directly read for detailed packet analysis by Ethereal. This is particualrly handy for recording complex sets of packet streams that Ethereal cannot differentiate and then sending the entire contents to Ethereal for detailed inspection. Other common tools also use this format. CSV produces Comma Separated Value files containing date, time, source, destination, ports, and content. Text is similar to CSV except that it produces text without the commas and quotes used by CSV.
Data format: The 'content' portion of the packet can be logged in text or hex format.Text, HEX. Text is handy for things like TCP packet contents, while HEX is better for binary data that is to be interpreted later. This parameter selects packets based on content
| Pattern | Enter a regular expression if you ONLY want matching packets |
Pattern to match: This is a user generated pattern that is fed to a regular expression paser to determine whether or not to record this packet. As a good example, if you watch POP3 destination traffic and use the pattern '^USER' you will record all of the user IDs used in POP3 email. If you add another rule with '^PASS' you will get the passwords as well.

| [Continue/Stop] | Go on to the next rule / or not even if this rule causes a log |
| [Silent/ | Silent produces no console output |
| .../ | This produces a '.' on the console for every packet logged |
| Headers/ | This displays headers on the concole for logged packets |
| Details] | This displays packet contents on the concole for logged packets |
| otherwise | If you fill in a character or string in the entery area it will be displayed on the console for every packet logged |
Continue: If you select Continue, subsequent rules will also be examined to produce additional log entries if applicable. If you select Stop, no subsequent rules will be triggered if this rule caused a log entry.
Console output: When you run the logger, console output can be generated in the logger window. Selections include: (1) Silent for no output, (2) Headers for lists of headers of triggered logging events, (3) Details, for details about packets including the first several bytes of TCP and UDP content, (4) '...', produces a single '.' for each time this rule produces a log output, or the user can specify a different character or character sequence that will be printed each time a log is generated. This is handy for cases when different rules generate different output chartacters to allow the user to track how many of what are hapenning how quickly. Output can be redirected to a file for additional logging of the logger activites if desired, and silence can be used througout if logging is configured for automatic restart on power outage or reboot.

| [Add] | Adds a new rule to the rule set for this specification |
| [Delete] | Deletes the marked rule from the rule specification |
| [Load] | Loads the marked rule into the rule specification areas |
| [Edit] | Load and delete the marked rule - you [Add] a changed version |
| [Refresh] | Refresh the screen (should noever be needed) |
| [Convert] | Convert the specification to a runnable logging specification |
| [TestRun] | Convert the specification and do a test run in a console window Press [CTRL]-C in that window to stop the test run |

The lower display area lists the rules within the specification file in internal format. It consists of:
| The date and time the rule was entered |
| The Ethernet interface affected (* for all interfaces) |
| Each of the packet types involved |
| The console logging specification |
| The continuation setting |
| The file type for logging |
| The data type for content logging |
| The name of the logfile to be used |
| The source IP, Port, MAC address |
| The destination IP, Port, MAC address |
| Any pattern to be matched |
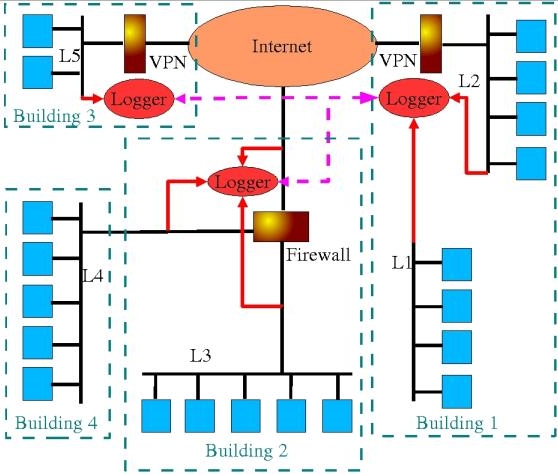
Figure 2 shows typical placement and applications for the Logging and Sniffing Server. This figure depics an enterprise with 4 buildings, 5 Local Area Networks(LANs) L1, L2, L3, L4, and L5, hosts on those LANs, Virtual Private Network (VPN) between some of those LANs, Internet connectivity, a firewall in building 2, and logging servers.
LAN L1 is isolated from the other networks, something typicaly done for security reasons. It is a good assumption that nothing in L1 is allowed to pass to L2 or anywhere else. The Logger in Building 1 will not pass the information onto L2 unless explicitly told to do so by the operator by changing the normal configuration of the Logger through manual action. If it is desirable that these functions be locked out, the Logger can be configured so that this will only be feasible by booting the Logging server from a CD-ROM or altering the way the system starts up. In this configuraiton, depending on what the Logger is configured to collect, all of the content of L1 could be stored for examination.
Another very handy way to use the server in Building 1 is to use it to check wheter IP addresses from L1 appear on L2 or vica versa. This is easily done by adding a series of rules to a Logger specification that log any instances where an IP address or MAC address from L1 appear on the interface of L2. A similar logging specification can be built to log any instances where an IP address or MAC address from L2 appear on the interface of L1. Anything that generates a log entry under either of these specifications represents a violaiton of policy.
Another interesting application for the logger in Building 1 is the collection of SYSLOG protocol outputs from L1 and L2 in a single collection. In this case, a spsecificaiton is created to listen to SYSLOG traffic on all interfaces and record them all in one file. This means that the sequence of arrivals of syslog packets from both networks will be reflected in the sequence in the log file and that even an attacker who deletes the logfiles from one of the computers on either LAN will not be able to delete the SYSLOG entries on the Logger.
Some other interesting Logger applications can be seen in the Logger in Building 2. In this case, one logger is listening to 3 different networks; L3, L4, and the Internet connection outside the firewall. A really interesting application is to see how effective the firewall is, perhaps during an outside firewall scan. While the firewall may cause the outside tester to fail to gain any useful intelligence, it may be that the firewall is not actually doing its job right. For example, it may be that packets are getting through the firewall that shouldn't get through but that services on the inside of the firewall are not resulting in feedback getting back to the tester. Or perhaps the firewall is sending some packets to both other interfaces or the wrong one. Perhaps a network address translation is not working properly. There are a lot of things that can go wrong. The only way to tell what is really happening is to watch all of the interfaces simultaneously and observe the differences between them. This is where the Logger comes in.
By configuring the Logger to send output from each interface to a different "dump" file, the logger can collect all of the packets from each interface, keeping them in separate files, but with nearly the same time base. Ethereal - the built-in packet analyzer, can then be run three times. Select Ethereal from the [Administrators] [Sniffers] menu using the mouse. Do this three times. Then adjust each of the windows to allow all three to be seen on the screen. In each one open the "dump" file associated with this logging session. You can see the precise sequence of packets on each side of the firewall right next to each other. You can even drill down into the packets and see the timings associated with going from one side of the firewall to the other for different kinds of packets.
This debugging by comparison of network traffic is very handy. It is useful for finding out what is failing in routers and gateways, for comparing traffic from remote sites traversing over a VPN, and for comparing encrypted packets to non-encrypted packets to assure that encryption is really working. When some packet is being dropped by a firewall or for some reason some protocol is not working right, one of the first things many network engineers do is put up a sniffer to see what's going on. With Logger already in place, this process is instantaneous on as many networks as the Logger is connected to.
Another important useful part of the Logger is that it can do many functions at the same time. For example, keeping copies of all SYSLOG traffic might be done all of the time as a backup to critical log files. At the same time, the Logger might keep copies of all of the transaction traffic associated with a transaction server so that in case of a failure the data can be replayed. While these two functions are underway, the Logger might also be configured to collect data from one or more investigations of specific behaviors by specific users. And even as this is underway, it can be used to debug network connectivity and look for traffic that doesn't belong in the network. All of these can be done at the same time, each viewing and collecting only what it needs to do its job.
Still another function of a Logging server might be to collect all of the data on an interface over a period of time. In the same way a a surveillance station can keep videotapes of multiple cameras and retain those tapes for some number of hours until they are recycled, the Logger can keep complete logs of network traffic on multiple interfaces, throwing out the old data as new data replaces it when space runs out. In case of an incident, historical records can be gathered before the disk space is recycled for a detailed history of the events. You can even generate a replay of the traffic sequence with timing to try to understand what took place.
In this particular case, there are 3 logging servers, and they are located in different buildings, perhaps hundreds of miles away. While local control is really the best way to assure that the Logger is completely covert and safe from intrusions, it is possible to configure Logger to run with remote control from another Logger.
As you can see from the many examples above, the key to where to place the Logger and its interfaces comes from the traffic you wish the Logger to observe. Most people place a Logger at the point of entry to their network, at critical access points, like just inside dial-in modem banks and at interfaces to outside corporate LANs, on floors of buildings that each have separate LANs, and in key spots for surveillance and debugging, like both sides of a firewall.
The example in Figure 2 shows a case where a LAN in Building 4 is observed by a Logger in Building 2, presumably using either the connection to the firewall or a long cable run between buildings to make the connection. A Logger on one floor of a building might be used to do logging from 4 floors of that building, resulting in one logger per 4 floors, placed in the wire closet, and with a control control station for the whole building in the security and surveillance area of the structure. For organizations separated into functional areas by system role, an interface into each functional area might be appropriate. For high valued assets such as critical wire transfer computers, keystroke logging and network-based keystroke collection might be used with the Logger keeping copies of the surveillance information.
The key things to understand are really very simple. (1) The Logger can only observe packets passing by its interfaces. (2) In normal operation, the Logger is completely covert with respect to network traffic, so you don't need an IP address or other similar configuration information in order for it to operate. Just plug it into a Hub and it can start listening. (3) The more data you collect, the more you have to sort through to get meaningful results, so choose what to log with th filtering capabilities and place the Logger where it can see as much traffic as possible.
Logging and sniffing is often defeated through the use of switches instead of hubs for LANs. This is an excellent protection against packet sniffing, and of course it prevents the logging and sniffing server from observing packets unless you do something to fix the problem. One solution is to use the "port mirroring" feature of some switches, or the Virtual LAN (VLAN) feature of others to create copies of traffic on some ports to send to the Logger. This works, but it takes a lot of ports on the switch in some cases. In other cases, you may not want to log all traffic between computers, but may decide to log only traffic going to and from the firewall or between LANs. In this case, the problem is far less severe. You can simply attach a hub to the switch right next to the firewall and allow the Logger to listen to the traffic as it passes in and out of the firewall interfaces. If there are multiple LAN segments already in place, more interfaces can be added to the higher end hardware versions of the Logging server to make connections to more LANs, but this rarely solves the problems.
There are other solutions to this problem, but none of them are ideal. Indeed the problem of logging and sniffing is in many ways the same as the problem that intrusion detection and response systems have. Unless traffic is visible, it cannot be logged.